Granite River Labs (GRL)
By Robert Yang – Test Engineer, GRL (Taipei)
DisplayPort™ is a high-speed, unidirectional transmission technology that offers high-quality display transmission performance. The latest version, DisplayPort™ 1.4 (DP 1.4), provides the highest resolution transmission capabilities available on the market, delivering stunning images with resolutions of up to 7680x4320 @60Hz (8K). Source transmitters (such as computers) output high-speed signals to the Sink receiver (such as screens) to produce high-quality images.
Comprehensive testing of the Physical Layer of DP 1.4, both for the Transmitter (Tx) and Receiver (Rx) is crucial to ensure optimal performance. In this article, we'll break down the testing process into two concise sections to help you navigate this complex topic with ease.
DP 1.4 Tx Equalizer test
Grasping the significance of the DP 1.4 Tx Equalizer is the first step to understanding the PHY test. Signal loss is an unavoidable issue due to factors such as the PCB circuit or cable quality, even with the high speed DP 1.4 interface. In rare cases, the signal sent to the Sink may not even be identifiable. To combat signal loss, DP 1.4 incorporates different enhancement modes (EQ) for the DisplayPort™ Tx and Rx terminals.
The DP 1.4 Tx terminal uses Swing/Pre-emphasis at varying levels to improve the signal. Swing refers to the adjustment of the output signal’s amplitude, while Pre-emphasis refers to the pre-emphasizing of the first bit of the continuous signal. The higher the Pre-emphasis Level, the greater the enhancement ratio (first bit/subsequent continuous bit).
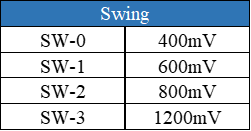
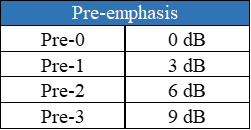
Table 1:Transmitter EQ of varying Swing/Pre-emphasis levels
DP 1.4 Rx Equalizer test
At the DP 1.4 Rx terminal, the high-speed signal is restored using Decision Feedback Equalization (DFE) and ten different Continuous Time Linear Equalizers (CTLEs). CTLE is a transfer function designed to enhance different signal frequencies. It amplifies the high-frequency components of the signal while attenuating the low-frequency components to achieve balance, allowing for an ideal eye diagram to be received on the Rx side. The combination of DFE and CTLE ensures that the transmitted signal is accurately restored, even if considerable losses are incurred during transmission.
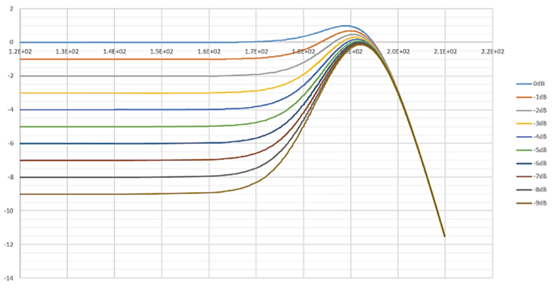
Figure 1:DP1.4 CTLE (Rx EQ) for HBR3
DP 1.4 Transmitter (Tx) PHY tests
During the Tx signal test, the Device Under Test (DUT) is connected to the Reference Sink, which induces the DUT into entering test mode. Then, the types and parameters of output signals are changed to perform various tests, such as testing different patterns, adjusting Swing/Pre-emphasis levels, and enabling/disabling Spread Spectrum Clocking (SSC). These tests aim to evaluate the DUT's compliance with the DP 1.4 standard for signal transmission.
| DP 1.4 Test Pattern | Pattern Usage |
| D10.2 | Clock signal used to restore Data Rate, analyze Non-ISI Jitter |
| PRBS7 | Used to analyze the eye diagram and jitter of low-speed signals (HBR and RBR) |
| HBR2CPAT | Used to analyze the eye diagram and jitter of HBR2 |
| TPS4 | Used to analyze the eye diagram and jitter of HBR3 |
| PLTPAT | Used to analyze whether Tx EQ (Swing/Pre-emphasis Level) meets the standard |
Table 2: DP 1.4 test patterns for Tx test
Eye diagram test
The eye diagram test is a fundamental method for verifying signal quality. It involves analyzing the eye width and eye height of a signal's eye diagram to determine if they intersect with the Eye Mask. This provides an indication of whether the Sink can correctly recognize the signal output by the Source.
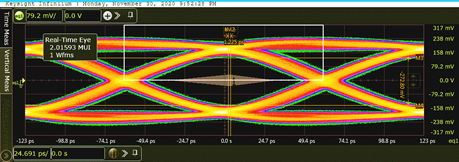
Figure 2: DP 1.4 eye diagram
Jitter test
Jitter is the most significant factor that affects signal quality. To ensure high-quality signal transmission, it's important to understand the various types of jitter that can impact signal performance. There are two main categories of jitter: Deterministic Jitter (DJ) and Random Jitter (RJ). DJ can be further classified into SJ, DDJ (ISI), and BUJ.
- Random Jitter: Commonly caused by uncertain interference factors such as thermal interference and environment
- Deterministic Jitter:
- Sine Jitter (SJ): Periodic jitter, often caused by interference sources such as oscillators on the circuit board and power supply
- ISI (Inter Symbol Interference): ISI interference tends to increase with signal path length
- Bounded Uncorrelated Jitter (BUJ): Refers to the variation in the timing of signal edges or pulses that are not correlated with any specific signal characteristics or system parameters
- Total Jitter (TJ): To analyze jitter in DP testing, it's important to consider all of these factors and measure Total Jitter (TJ), which is the sum of all the different jitter components (Table 3)
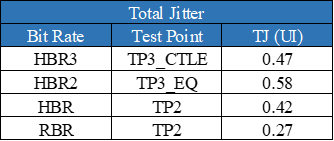
Table 3: DP 1.4 Total Jitter test criteria
Spread-Spectrum (SSC) test
To reduce the likelihood of high-speed signals creating interference by concentrating in a certain frequency band, DisplayPort™ adopted Spread Spectrum Clocking (SSC) technology to break up the Data Rate frequency. When testing SSC, the frequency and scale need to be measured separately. The Compliance Test Specification (CTS) specifies the following test standards for SSC.
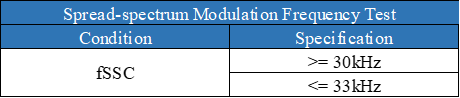
Table 4: DP 1.4 SSC test standards
VTX test (Swing/Pre-emphasis ratio test)
The Swing to Pre-emphasis ratio of the output signal is crucial to ensure signal quality. The Pre-emphasis Level Test Pattern (PLTPAT) is used to verify whether this ratio is sufficient. During the test, the oscilloscope converts the signal from the time domain to the frequency domain, and the ratio of Transition Bit to Non-Transition Bit is calculated to determine if it falls within the acceptable range.
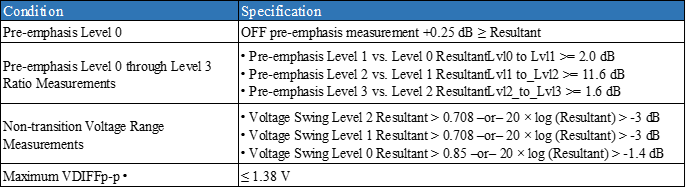
Table 5: Swing & Pre-emphasis Level test criteria
DP 1.4 Receiver (Rx) PHY tests
For the Rx test, communication with the DUT (Sink) is established through the Reference Source to induce the Sink DUT to enter the test mode. A noisy signal containing Random Jitter, Sine Jitter, ISI, and Crosstalk is then input to the Sink through a BERT (bit error rate tester or signal generator) to verify whether the IC at the Rx can accurately interpret the benchmark bits (0 and 1) in the signal.
Observing how bright lines flash across the screen with the naked eye can be used as a method to confirm whether the IC at the Rx has accurately interpreted the input signal. However, this is not sufficient past a certain high-speed signal threshold. Unfortunately, the USB interface in the DP design does not have a Loopback mode. Therefore, the DPCD (DisplayPort™ Configuration Data) is written and read during the test to determine whether there is a signal error at the Sink. The DPCD is stored in the Sink IC, where the specifications of the Sink (DP version, maximum speed, number of channels supported) are indicated. In addition, values can be written in the DPCD for link training communication between the Source and the Sink.
During the test, the Sink is informed of the test pattern that will be input by writing the DPCD to a specific address. When the Sink finds inconsistent bits after comparing the input signals, the number of errors is recorded in the Register of Error Count.
There are three steps for the Sink PHY test, with different patterns output by the BERT at different stages (Figure 3).
- Frequency Lock: The initial stage where transmission speed and several lanes are compared.
- Symbol Lock: During this intermediary stage, EQ is adjusted to test Pattern Alignment.
- Error count: At this final stage, Test Patterns are compared and the error amount is recorded.
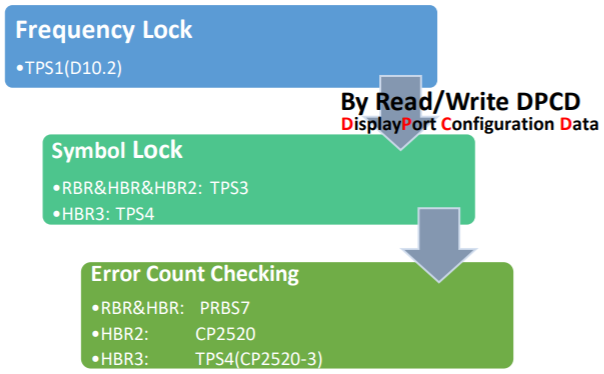
Figure 3: DP 1.4 Sink PHY test process
According to the CTS, the "Error Count" of the Sink is observed for a certain period to determine if it has passed or failed the test (Table 6).
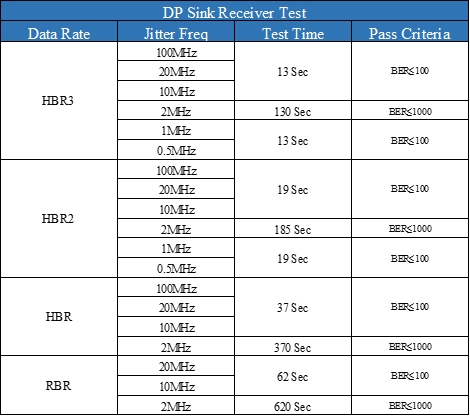
Table 6: DP 1.4 Sink Receiver test speeds and criteria
Test and comply with VESA DisplayPort 1.4 standards by testing
Ensure that your products are compliant with the latest standards with GRL's DisplayPort™ 1.4 compliance testing services. Our experienced team and state-of-the-art testing equipment will put you on the fastest path to certification while ensuring that your products meet the latest DisplayPort™ standards for high performance and reliability. Contact us today to learn more and schedule your testing.
References
- VESA DisplayPort (DP) Standard Version 1.4a 19 April 2018: https://vesa.org/
- VESA DisplayPort v1.4a PHY Layer Compliance Test Specification, Rev1.1, 05 June 2020: https://vesa.org/
Author
Robert Yang – Test Engineer, GRL (Taipei)
Robert has four years of testing experience and is familiar with the testing specifications for DisplayPort™, Thunderbolt, and HDMI®, USB. He is currently responsible for compatibility testing at GRL (Taipei) and helps customers solve problems and successfully obtain certification.


.png)
/DisplayPort%E2%84%A2%202.0%20Overview_featured%20image.jpeg)
/adaptive%20sync.png)